I do not think it is still necessary to explain that phishing is a major threat for businesses and individuals. By now, most companies have one type of phishing training or another. But, does it work?
Phishing exercises are, so far, the best way to measure the susceptibility of people to fall for a Phishing email. So, if we want to measure if our training is working, we launch a Phishing exercise before the training, and then, we perform another after. If our Phishing education was efficient, we should see a negative trend. Right? If we perform exercises every quarter, we should obtain something like that:
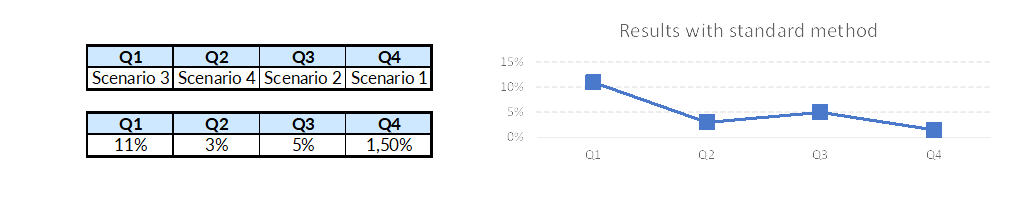
Looks good, isn’t it? Except we don’t know why there is a bump in the numbers in Q3. Maybe is it due to the summer holidays. Who knows?
Well, maybe it’s due to the scenario you used. If we had performed the exercises with the same scenario in a different order, we might have had something more like this:
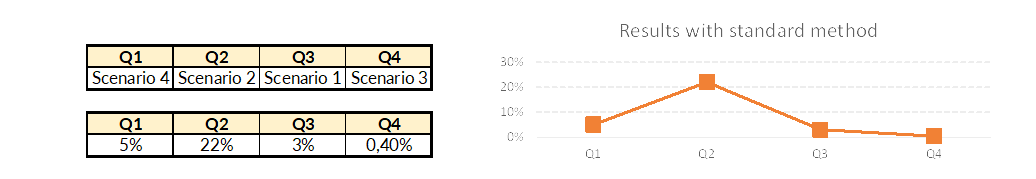
Less impressive, isn’t it? And we would probably have some difficulty to explain the serious increase in numbers in Q2. What could be wrong? Our measurement is wrong.
Siadati et al. published an excellent article in 2017 highlighting this very issue. As the variance between scenarios can be as high as 40% (our research showed that it could be up to 60%), we cannot rely on inter-scenarios measurement to measure the efficiency of our training. To say otherwise, the difference in the percentage of people clicking on a phishing link between two phishing scenarios sent to the same people at the same time can be as high as 60%.
Instead, they suggested using a system using multiple scenarios in parallel. The scenarios are used repeatedly with different groups of the population (groups are randomized). In our example, this would give this:
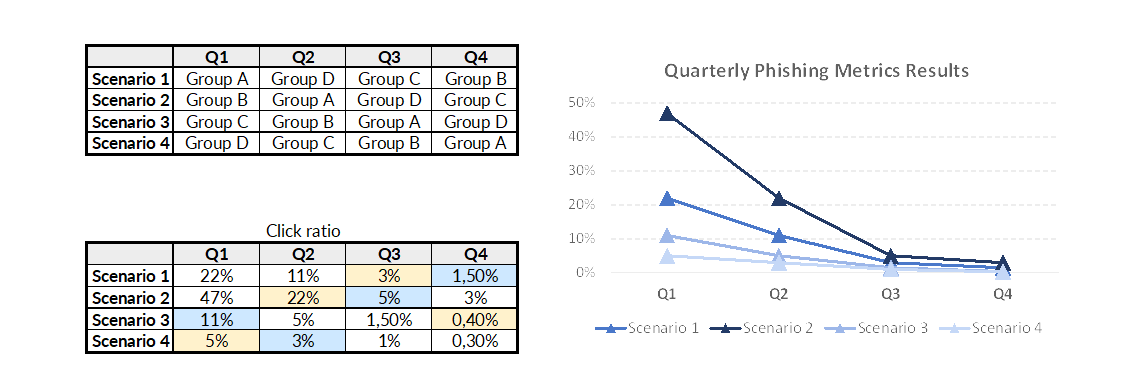
As you can see, we now have the four same scenarios sent to four groups of people in our population. Notice the 42% gap between scenario 2 and scenario 4 in Q1. The blue and yellow cells highlight the numbers we used for the two previous examples. Sames scenarios, same people, and a totally different, more accurate, measurement of our progress.
This protocol requires a yearly plan (that we should have anyway) and a sufficently big enough population to have, at least, 30 persons in each group (for statistical signifiance).
There are, unfortunately, other pitfalls in our metrics that we have to take into account but that will be the subject of another post (and included in a short document we will publish very soon).
Reference:
Siadati, H., Palka, S., Siegel, A., & McCoy, D. (2017). Measuring the effectiveness of embedded phishing exercises. 10th {USENIX} Workshop on …, Query date: 2019-03-12. https://www.usenix.org/conference/cset17/workshop-program/presentation/siadatii